How to Benchmark Website Performance
Tools, Metrics, and Best Practices
Introduction
Website performance benchmarking is one of the key aspects of managing an efficient and successful website. Whether you’re a website owner or a beginner web designer, understanding how your site performs can make the difference between users staying on your site or bouncing off in frustration. Slow websites lead to poor user experience, low search engine rankings, and decreased conversions, so it’s critical to measure and optimize performance regularly.
In this guide, we’ll explain what website performance benchmarking is, how to use essential tools like PageSpeed Insights, GTmetrix, and Google Lighthouse, and give you a step-by-step process to confidently benchmark and improve your website’s performance.
Table of Contents

What is Website Performance Benchmarking?
Definition of Website Performance Benchmarking
Website performance benchmarking is the process of measuring your website’s speed, responsiveness, and overall functionality using standardized metrics. These measurements help you understand how your site performs in real-world conditions, enabling you to identify areas that may need improvement. Think of benchmarking as taking your website’s pulse—just as you monitor your health by tracking vital signs, benchmarking keeps track of your website’s vitals to ensure it’s performing optimally. Understanding your website’s core web vitals is essential if you’re want to improve your websites performance.
Benchmarking helps you maintain a fast, responsive site that offers a positive user experience, which is crucial not only for retaining visitors but also for ranking higher in search engine results. The faster and more stable your site, the better your chances of converting visitors into customers and appearing on the first page of search engines like Google. With how much websites cost these days, you better make sure yours is running fast and performing like a thoroughbred horse.
Key Metrics to Benchmark
When you benchmark your website, you’ll need to focus on specific performance metrics that provide insight into how your site behaves under real user conditions. These metrics are especially important because search engines like Google prioritize user experience in their rankings. Here are some of the most important ones to monitor:
Page Load Time: This is the total time it takes for a webpage to load fully. Websites should aim to load in under 3 seconds, as anything slower can cause visitors to leave before the page finishes loading.
Time to First Byte (TTFB): TTFB measures the time it takes for a user’s browser to receive the first byte of data from the server. Faster TTFB times (under 200 milliseconds) indicate a responsive server and an efficient website.
First Contentful Paint (FCP): FCP marks the time when the first piece of meaningful content—such as text or an image—is displayed on the screen. An optimal FCP time is under 1.8 seconds.
Largest Contentful Paint (LCP): This metric measures the time it takes to load the largest visible content element, which could be an image, video, or large block of text. A good LCP score is below 2.5 seconds.
Time to Interactive (TTI): TTI refers to the point when the page becomes fully interactive, meaning users can interact with elements like buttons, forms, and links. A TTI of under 3.8 seconds is ideal.
Cumulative Layout Shift (CLS): CLS measures how stable the layout of your website is as it loads. A poor CLS score means elements shift around as the page loads, frustrating users. A good CLS score is below 0.1.

Tools for Benchmarking Website Performance
To accurately benchmark your website’s performance, you’ll need to use performance testing tools. These tools analyze your site’s speed and give actionable insights into what’s working and what needs to be improved. Below are three highly recommended tools that are easy to use even for beginners.
PageSpeed Insights
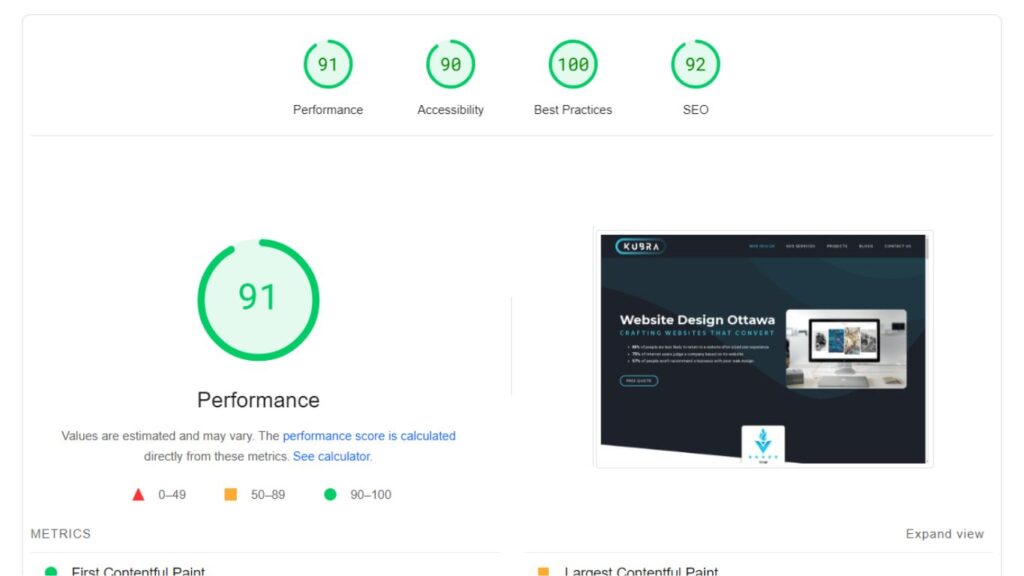
PageSpeed Insights is a free, web-based tool from Google that analyzes the content of a web page and generates suggestions for improving speed. It’s an excellent starting point for beginners because it’s simple to use, provides a clear performance score, and highlights specific areas for improvement.
How to Use PageSpeed Insights:
- Go to PageSpeed Insights.
- Enter the URL of the website you want to analyze.
- Click on “Analyze.”
- The tool will generate a report with performance scores, focusing on Core Web Vitals (LCP, FID, CLS) and other performance metrics.
- Review the suggestions for improving performance, which could range from optimizing images to reducing server response time.
Analyzing PageSpeed Insights Reports:
PageSpeed Insights will break down the results into mobile and desktop performance. It also provides a performance score (out of 100) based on several factors, including how long your site takes to load and when users can interact with it. The tool will offer suggestions such as image optimization, removing unused JavaScript, or leveraging browser caching.
GTmetrix
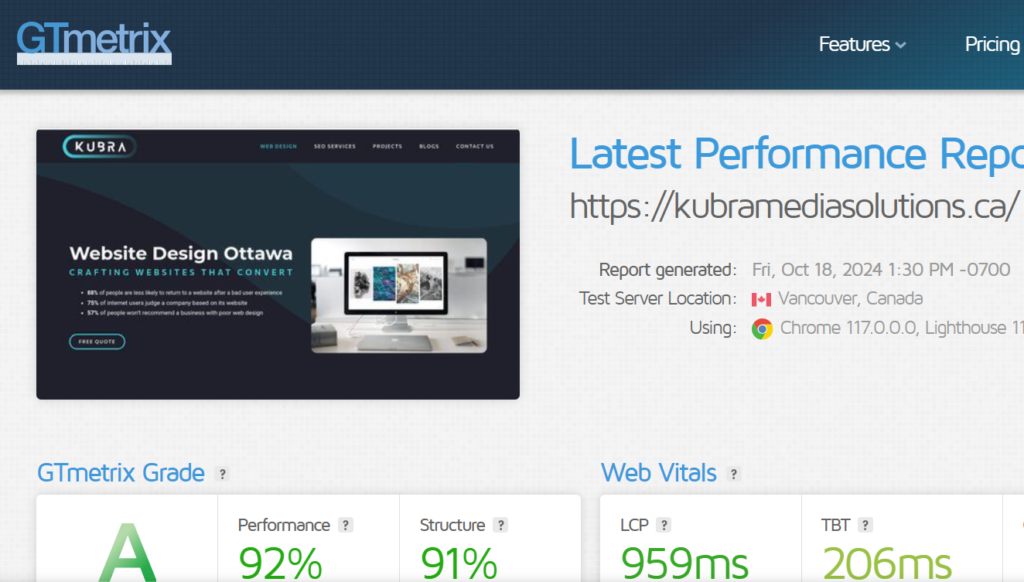
GTmetrix is a more advanced tool that provides a detailed breakdown of a website’s speed, using waterfall charts to show how individual elements load. It’s particularly useful for visualizing how each resource—such as images, CSS files, and JavaScript—affects the overall load time.
How to Use GTmetrix:
- Go to GTmetrix.
- Enter the URL of your website and click “Test your site.”
- GTmetrix will analyze the page and provide a detailed report that includes both a grade (A-F) and performance scores for speed, structure, and load time.
- The waterfall chart shows how each element loads, helping you identify specific slow-loading resources.
Analyzing GTmetrix Reports:
Look at the performance score and the specific recommendations it provides. For example, if it suggests “Serve scaled images,” it means some images on your site are larger than necessary and could be scaled down to improve loading time.
Google Lighthouse
Google Lighthouse is another tool offered by Google, built directly into Chrome’s Developer Tools. It audits a website for performance, accessibility, SEO, and best practices, providing a detailed report on what can be improved.
How to Use Google Lighthouse:
- Open your website in Chrome.
- Right-click anywhere on the page and select “Inspect.”
- Go to the “Lighthouse” tab in the developer tools.
- Select the categories you want to audit (e.g., Performance, SEO) and click “Generate Report.”
- Lighthouse will audit the page and display a report with scores for each category.
Analyzing Lighthouse Reports:
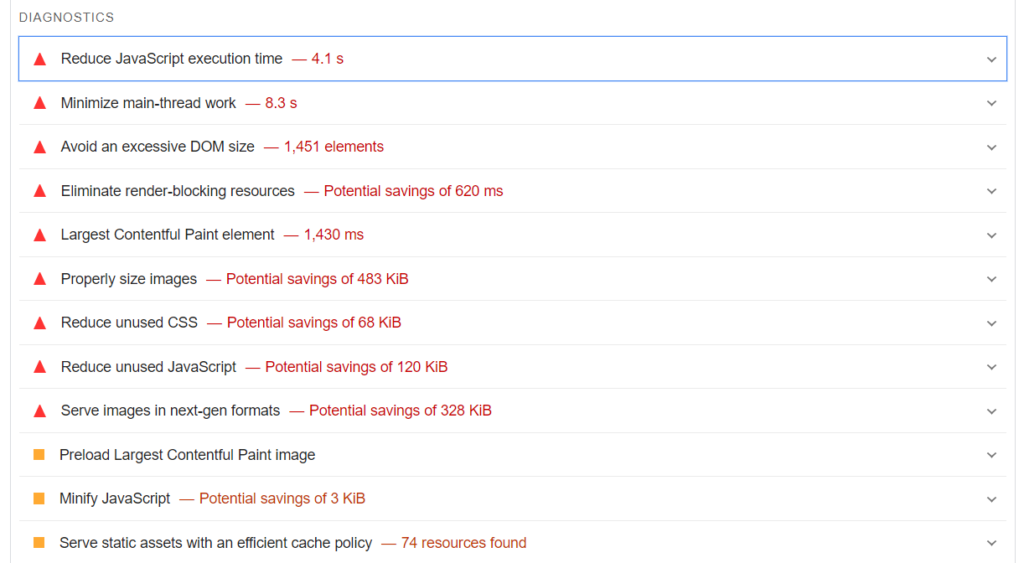
The report will provide detailed feedback on various aspects of your site, including performance issues like render-blocking resources, large JavaScript files, and inefficient server responses. It will also offer actionable recommendations, such as deferring non-essential JavaScript and improving accessibility features.

Steps to Benchmark Your Website Performance
Benchmarking your website is not a one-time task but an ongoing process. Here’s a step-by-step approach to effectively benchmark and improve your website’s performance.
Step 1: Establish a Baseline
Before you start optimizing your website, it’s essential to establish a baseline. This means running performance tests to get a snapshot of how your website currently performs. Use tools like PageSpeed Insights, GTmetrix, and Google Lighthouse to test your site across multiple devices and browsers.
- Run each tool multiple times to account for any variability in performance scores.
- Record key metrics such as LCP, FCP, TTI, and CLS for both mobile and desktop versions of your site.
- Keep a record of your baseline results to track improvements later.
Step 2: Compare Results
Now that you have your baseline data, compare the results from each tool. While tools may measure different things, certain metrics—like page load time and LCP—should give you a consistent idea of your site’s speed.
- Look for recurring issues in the reports, such as slow server response times or unoptimized images.
- Prioritize fixing the most impactful issues first, such as large images or render-blocking JavaScript, as these often have the most significant effect on performance.
Step 3: Identify Areas for Improvement
Once you’ve compared the results, it’s time to dig into the specific recommendations provided by each tool. For example, PageSpeed Insights might suggest compressing images or enabling browser caching, while GTmetrix may recommend reducing the number of HTTP requests by combining CSS and JavaScript files.
- Categorize the issues into those that require immediate attention (e.g., large images) and those that can be addressed later (e.g., reducing CSS file size).
- Prioritize improvements that will have the most significant impact on the user experience.
Step 4: Implement Fixes and Re-Benchmark
After making the necessary changes, it’s essential to re-run the tests to see if your optimizations had the desired effect. Use the same tools to re-benchmark your site and compare the new scores to your baseline results.
- If your performance metrics improve, continue optimizing other areas.
- If there’s little improvement, revisit the suggestions and try alternative approaches, such as upgrading your hosting plan or using a content delivery network (CDN).

Advanced Tips for Improving Website Performance
Optimize Core Web Vitals
Google’s Core Web Vitals—LCP, FID, and CLS—are critical to website performance and user experience. Ensure you’re optimizing these metrics for both mobile and desktop by addressing issues like slow loading times, poor interactivity, and unexpected layout shifts.
- Improving LCP: Compress and optimize large images, upgrade to faster hosting, and minimize CSS and JavaScript.
- Reducing CLS: Use fixed-size containers for images and ads to prevent layout shifts and avoid using dynamically injected content.
Optimize Server and Hosting
Your server’s speed plays a huge role in website performance. If your website is hosted on a shared server, it might suffer from slow response times during peak traffic periods. Consider upgrading to a faster hosting plan or using a CDN to deliver content more efficiently.
Reduce Render-Blocking Resources
Render-blocking resources like JavaScript and CSS files can significantly slow down your website’s performance. You can minimize their impact by deferring non-critical scripts and stylesheets until after the page has loaded.
- Lazy-loading images: This allows images to load only when they are visible on the user’s screen, improving initial page load time.
- Minifying CSS and JavaScript: Compress your code by removing unnecessary characters like spaces and line breaks.
Conclusion
Website performance benchmarking is an ongoing process that can drastically improve your site’s speed, user experience, and search engine ranking. By using tools like PageSpeed Insights, GTmetrix, and Google Lighthouse, and following the steps to establish a baseline, compare results, and implement improvements, you’ll have the data and insights necessary to make informed decisions about your website’s performance.
Continue monitoring your site and optimizing based on the latest benchmark results to ensure your site remains competitive and user-friendly.
FAQs
What is a good PageSpeed score?
A score of 90 or above is considered good, but anything above 80 indicates solid performance.
How often should I benchmark my website?
It’s a good idea to benchmark your website once a month or after any significant update.
Can I fix all performance issues myself?
Some issues, like optimizing images, can be done yourself, while others, such as upgrading your hosting plan, may require assistance from a developer.
What is the best free tool to benchmark website performance?
PageSpeed Insights, GTmetrix, and Google Lighthouse are all excellent free tools for benchmarking website performance. Each offers different insights, making it useful to use all three together for a complete analysis.
How do I know if my website is too slow?
A: If your website takes longer than 3 seconds to load, users are more likely to leave, which can increase bounce rates and reduce conversions. Tools like PageSpeed Insights and GTmetrix will give you a detailed breakdown of load times and suggest improvements.
